主な特長
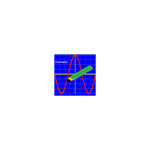
What CalChart will do for you. •Calculate formulas and draw graphs of lines based on the formulas. •Enable math students to create and explore formulas and solutions for intersecting formulas. •Enable math teachers to present and demonstrate concepts and characteristics of mathematical formulas. •Formulas can be entered and then plotted on an X,Y plane. •Built-in math functions plot straight lines and curves with one formula or as a combined group of lines on a shared X,Y plane. •Customizable configuration of the X,Y axes, captions and colors of lines as well as color of the background.
CalChart plots lines based on points generated by a formula: •You specify a formula and then CalChart calculates the points as (x,y) pairs and draws the lines. •A set of x values is described as a property of a chart and a matching y value is computed for each x value substituted in the formula. •The x,y pairs are sequenced on the x value and line segments are drawn from each x,y pair to its adjacent x,y pair. •Multiple formulas may be plotted on the same graph. •The generated (x,y) pairs can be viewed as a list by selecting the "Data" button.


