Snímky obrazovky:
Minimum
OS
Architekturax86,x64,ARM,ARM64
Doporučené
OS
Architekturax86,x64,ARM,ARM64
Popis
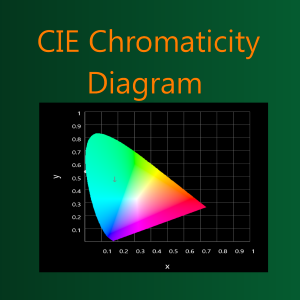
This is an interactive CIE 1931 chromaticity diagram that can be used by professionals in color science and technology, color related product design or anyone with an interest in color space. The diagram is drawn dynamically with the best accuracy that the display device can support. The tool allows the user to see the CIE xyz coordinates and RGB values of any selected point on the CIE chromaticity diagram. It also shows the area of the diagram that can be rendered by a standard display device based on RGB mixing and monochromatic (single wavelength) light of any selected wavelength. This is an ad-supported free version with the option of in-app purchase of the full version token to remove ads.
Lidem se také líbí
Hodnocení
čl.
O CIE Diagram
Advertisement
Oblíbené Stáhnout
- 1
iCloud
 Zdarma
 - 2
Adobe Acrobat Reader DC
Zdarma - 3
Microsoft Teams
Zdarma - 4
Lenovo Vantage
Zdarma - 5
Mozilla Firefox
Zdarma - 6
BreeZip: Rar, Zip & 7z Extractor
Zdarma
Nové a populární
- 1
Password App
Zdarma - 2
4-Organizer Ultra: AI-Powered Care
Zdarma - 3
Client for Email Services PRO
Zdarma - 4
Screen Capture Saver
Zdarma - 5
QR Reader - T.A.P. Tag Tech
Zdarma - 6
AcrobatX PDF Editor for Windows 11
Zdarma
Nejlépe hodnocené aplikace
- 1
iCloud
Zdarma - 2
Adobe Acrobat Reader DC
Zdarma - 3
Microsoft Teams
Zdarma - 4
Lenovo Vantage
Zdarma - 5
Mozilla Firefox
Zdarma - 6
BreeZip: Rar, Zip & 7z Extractor
Zdarma
Nejlépe hodnocené Hry
- 1
Angry Birds Friends
Zdarma - 2
Roger That: Merge Adventure Games!
Zdarma - 3
Minecraft Launcher
Zdarma - 4
Hidden City: Hidden Object Adventure
Zdarma - 5
Seekers Notes: Hidden Objects
Zdarma - 6
Bermuda Adventures: Farm Games
Zdarma